Overview
jqxGantt represents a type of bar chart that illustrates a project schedule with dependency links between each individual task and their current status. The chart lists the tasks to be performed on the vertical axis, and time intervals on the horizontal axis. The width of the task bars inside the Timeline shows the duration of each activity. The timeline is devided in multiple cells. Each cell represents a time interval dependin on the timeline view.
Getting Started with Gantt
jQWidgets UI package is distributed as jqwidgets-scripts NPM package. You can also get the full download from our website with all demos from the Download page.Setup the GanttChart
jQWidgets UI package is distributed as jqwidgets-scripts NPM package
- Download and install the package.
npm install jqwidgets-scripts
- Once installed, import the GanttChart module in your application.
<script src="node_modules/jqwidgets-scripts/jqwidgets/jqx.gantt.js"></script>
<script src="node_modules/jqwidgets-scripts/jqwidgets/jqx.gantt.api.js"></script>
-
Adding CSS reference
The jqx.base.css CSS file should be referenced using following code and also jqx.gantt.css .
<link rel="stylesheet" type="text/css" href="node_modules/jqwidgets-scripts/jqwidgets/styles/jqx.base.css" />
<link rel="stylesheet" type="text/css" href="node_modules/jqwidgets-scripts/jqwidgets/styles/gantt/jqx.gantt.css" />
- Add the GanttChart tag to your Web Page
<div id="ganttchart"></div>
- Create the GanttChart Component
	<script>
		const gantt = new jqxGantt('#ganttchart', {
				treeSize: '30%',
				durationUnit: 'hour',
				taskColumns: [
					{
						label: 'Tasks',
						value: 'label',
						size: '60%'
					},
					{
						label: 'Duration (hours)',
						value: 'duration'
					}
				],
				source: [
					{
						label: 'PRD & User-Stories',
						dateStart: '2021-01-10',
						dateEnd: '2021-03-10',
						class: 'product-team',
						type: 'task'
					},
					{
						label: 'Persona & Journey',
						dateStart: '2021-03-01',
						dateEnd: '2021-04-30',
						class: 'marketing-team',
						type: 'task'
					},
					{
						label: 'Architecture',
						dateStart: '2021-04-11',
						dateEnd: '2021-05-16',
						class: 'product-team',
						type: 'task'
					},
					{
						label: 'Prototyping',
						dateStart: '2021-05-17',
						dateEnd: '2021-07-01',
						class: 'dev-team',
						type: 'task'
					},
					{
						label: 'Design',
						dateStart: '2021-07-02',
						dateEnd: '2021-08-01',
						class: 'design-team',
						type: 'task'
					},
					{
						label: 'Development',
						dateStart: '2021-08-01',
						dateEnd: '2021-09-10',
						class: 'dev-team',
						type: 'task'
					},
					{
						label: 'Testing & QA',
						dateStart: '2021-09-11',
						dateEnd: '2021-10-10',
						class: 'qa-team',
						type: 'task'
					},
					{
						label: 'UAT Test',
						dateStart: '2021-10-12',
						dateEnd: '2021-11-11',
						class: 'product-team',
						type: 'task'
					},
					{
						label: 'Handover & Documentation',
						dateStart: '2021-10-17',
						dateEnd: '2021-11-31',
						class: 'marketing-team',
						type: 'task'
					},
					{
						label: 'Release',
						dateStart: '2021-11-01',
						dateEnd: '2021-12-31',
						class: 'release-team',
						type: 'task'
					}
				]
			});
	</script>
- Open the page in your web server.
The following code initializes an empty Gantt on the page:
<!DOCTYPE html>
<html>
<head>
 <link rel="stylesheet" href=../../jqwidgets/styles/jqx.base.css" type="text/css" />
 <link rel="stylesheet" href=../../jqwidgets/styles/gantt/jqx.gantt.css" type="text/css" />
 <script type="text/javascript" src="../../jqwidgets/jqx.gantt.js"></script>
 <script type="text/javascript" src="../../jqwidgets/jqx.gantt.api.js"></script>
</head>
<body>
    <div></div>
</body>
</html>
Define a dataSource
In order to create a project schedule the user first has to define a dataSource. The dataSource should be an Array of objects describing the tasks and their connections. There are three types of tasks:
-
Tasks - a task represent a single operation.
Let's take a closer look at a task's definition:
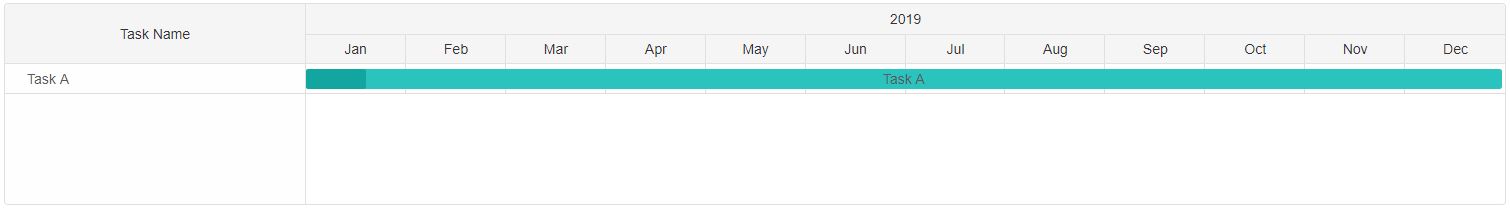
    const item = {
                   type: 'task',
                   label: 'Task A',
                   dateStart: '2020-1-1',
                   dateEnd: '2020-12-31',
                   progress: 5
                };
The following task definition will create a task that starts on 1st January 2020 and ends on 31st January 2020. It has a label "Task A" that is visible in the Task Tree and the Timeline. The type determines the type of the task. Progress property shows what the current status of the task is.
Here's how to create a GanttChart with a single Task:
<!DOCTYPE html>
<html>
<head>
 <link rel="stylesheet" href=../../jqwidgets/styles/jqx.base.css" type="text/css" />
 <link rel="stylesheet" href=../../jqwidgets/styles/gantt/jqx.gantt.css" type="text/css" />
 <script type="text/javascript" src="../../jqwidgets/jqx.gantt.js"></script>
 <script type="text/javascript" src="../../jqwidgets/jqx.gantt.api.js"></script>
<script>
 window.onload = function() {
    const ganttChart = new jqxGantt('#gantt', source: [
	{
	   type: 'task',
	   label: 'Task A',
	   dateStart: '2020-1-1',
	   dateEnd: '2020-12-31',
	   progress: 5
	}]);
}
</script>
</head>
<body>
    <div id="gantt"></div>
</body>
</html>
Demo
-
Project - a project is a Task group that can have sub-tasks. Although it can exist on it's own as a task.
Let's take a closer look at a task's definition:
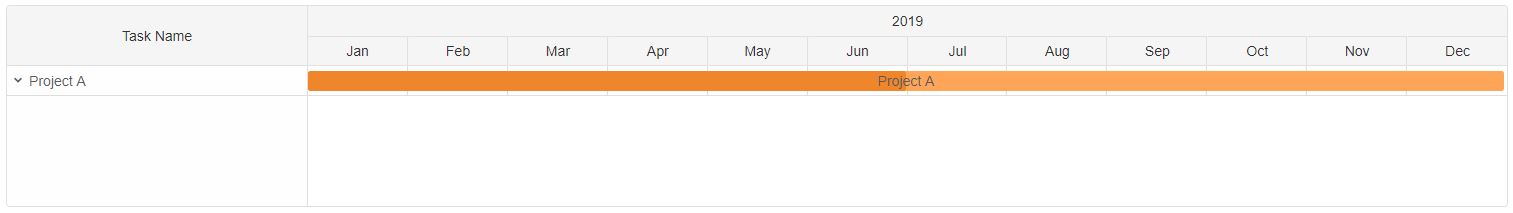
    const project = {
                    type: 'project',
                    label: 'Project A',
                    dateStart: '2020-1-1',
                    dateEnd: '2020-12-31',
                    progress: 50,
                    tasks: [
                        {
                            type: 'task',
                            label: 'Task A',
                            dateStart: '2020-1-1',
                            dateEnd: '2020-6-31'
                        },
                        {
                            type: 'task',
                            label: 'Task B',
                            dateStart: '2020-6-1',
                            dateEnd: '2020-12-31'
                        }]

                };
The following project definition will create a Project Task labeled 'Project A' with two sub-tasks: 'Task A' and 'Task B'. This gives a total of 3 tasks. The tasks attribute is used to define sub-tasks for a Project. By default Project tasks are not expanded. Pressing on the arrow icon infront of the task inside the Task Tree or calling the expand method will expand the task and reveal it's sub tasks.
Here's how to create a GanttChart with a Project that has two sub-tasks:
<!DOCTYPE html>
<html>
<head>
 <link rel="stylesheet" href=../../jqwidgets/styles/jqx.base.css" type="text/css" />
 <link rel="stylesheet" href=../../jqwidgets/styles/gantt/jqx.gantt.css" type="text/css" />
 <script type="text/javascript" src="../../jqwidgets/jqx.gantt.js"></script>
 <script type="text/javascript" src="../../jqwidgets/jqx.gantt.api.js"></script>
<script>
<script>
 window.onload = function() {
  const ganttChart = new jqxGantt('#gantt', source: [
  {
	type: 'project',
	label: 'Project A',
	dateStart: '2020-1-1',
	dateEnd: '2020-12-31',
	progress: 50,
	tasks: [
		{
			type: 'task',
			label: 'Task A',
			dateStart: '2020-1-1',
			dateEnd: '2020-6-31'
		},
		{
			type: 'task',
			label: 'Task B',
			dateStart: '2020-6-1',
			dateEnd: '2020-12-31'
		}]

}]);
}
</script>
</head>
<body>
    <div id="gantt"></div>
</body>
</html>
Demo
And here's how to create an expanded Project:
<!DOCTYPE html>
<html>
<head>
 <link rel="stylesheet" href=../../jqwidgets/styles/jqx.base.css" type="text/css" />
 <link rel="stylesheet" href=../../jqwidgets/styles/gantt/jqx.gantt.css" type="text/css" />
 <script type="text/javascript" src="../../jqwidgets/jqx.gantt.js"></script>
 <script type="text/javascript" src="../../jqwidgets/jqx.gantt.api.js"></script>
<script>
<script>
 window.onload = function() {
  const ganttChart = new jqxGantt('#gantt', source: [
  {
	type: 'project',
	label: 'Project A',
	dateStart: '2020-1-1',
	dateEnd: '2020-12-31',
	progress: 50,
	expanded: true,
	tasks: [
		{
			type: 'task',
			label: 'Task A',
			dateStart: '2020-1-1',
			dateEnd: '2020-6-31'
		},
		{
			type: 'task',
			label: 'Task B',
			dateStart: '2020-6-1',
			dateEnd: '2020-12-31'
		}]

}]);
}
</script>
</head>
<body>
    <div id="gantt"></div>
</body>
</html>
Demo
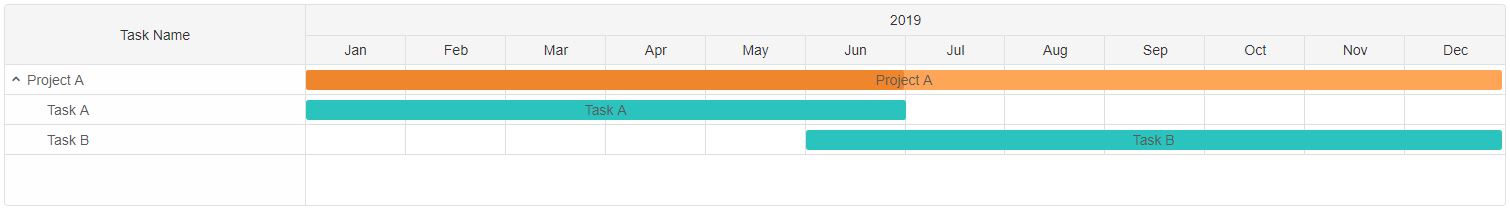
expanded attribute determines if the Project task is expanded or not.
-
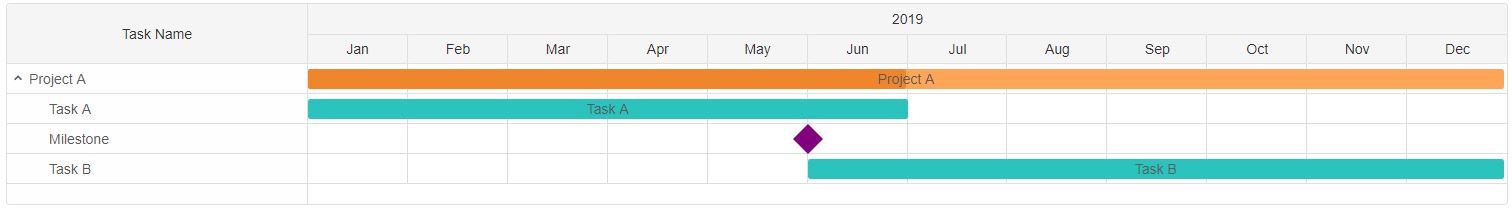
Milestone - is a task that doesn't have a duration. It's dateStart/dateEnd are the same. It's used to mark the end or a breakpoint of a Project. Milestone do not have progress nor sub-tasks. However they can be defined as a sub-task of a Project. Milestones are different in shape inside the Timeline to visually differentiate from the rest.
Here's how to define a milestone:
    const milestone = {
                    type: 'milestone',
                    label: 'Milestone A',
                    dateStart: '2020-6-1'
                   };
The following task definition will create a milestone.
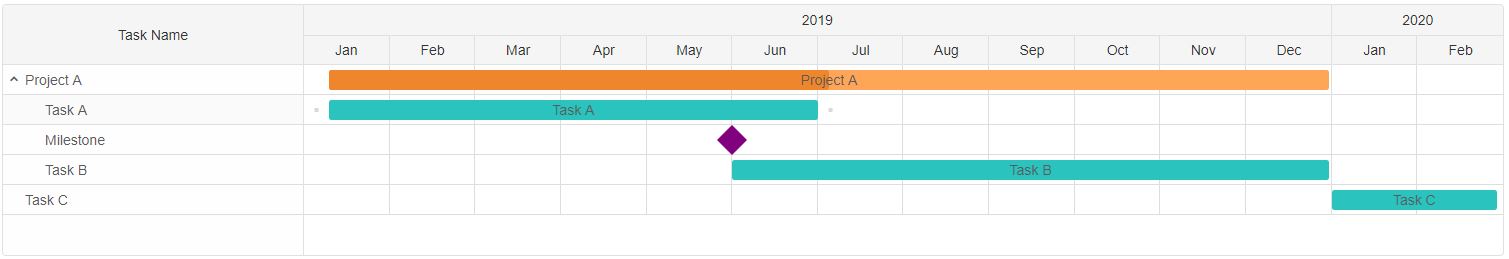
Here's how to create a Project with two tasks and a milestone:
<!DOCTYPE html>
<html>
<head>
 <link rel="stylesheet" href=../../jqwidgets/styles/jqx.base.css" type="text/css" />
 <link rel="stylesheet" href=../../jqwidgets/styles/gantt/jqx.gantt.css" type="text/css" />
 <script type="text/javascript" src="../../jqwidgets/jqx.gantt.js"></script>
 <script type="text/javascript" src="../../jqwidgets/jqx.gantt.api.js"></script>
<script>
<script>
 window.onload = function() {
  const ganttChart = new jqxGantt('#gantt', source: [
	  {
		type: 'project',
		label: 'Project A',
		dateStart: '2020-1-1',
		dateEnd: '2020-12-31',
		expanded: true,
		progress: 50,
		tasks: [
			{
				type: 'task',
				label: 'Task A',
				dateStart: '2020-1-1',
				dateEnd: '2020-6-31'
			},
			{
				type: 'milestone',
				label: 'Milestone',
				dateStart: '2020-6-1'
			},
			{
				type: 'task',
				label: 'Task B',
				dateStart: '2020-6-1',
				dateEnd: '2020-12-31'
			}]

	}]);
}
</script>
</head>
<body>
    <div id="gantt"></div>
</body>
</html>
Demo
Task Connections
Task Connections describe the relations between the tasks. Each task has an connections attribute that is used to which tasks to connect to. Connections attribute is applicable to all types of tasks. However there are several restrictions when it comes to task connections:
- Only one connection can exist between two tasks - if a connection exists between two tasks and the user creates a new one, the previous is deleted.
- Looping connections when autoSchedule is enabled are not allowed - when autoSchedule is enabled the tasks are repositioned depending on the connections. Tasks connected in a loop are not allowed becase they can't exist meaningfully inside the timeline.
Connections show which tasks start/end after another. This gives the possibility to automate the planning process.
Connections are defined as an Array of Objects. Each object represents a connection that has two attributes:
- target - the index of the target Task that the current task will connect to.
-
type - the type of connection. There are four types of connections:
- Start-to-Start - connects the start of one task to the start of another. The target task can't start until the start task begins.
- Start-to-End - connects the start of one task to the end of another. This means that the target task can't end before the start task is begins.
- End-to-Start - connects the end of one task to the start of another. This means that the target task can't start before the start task is finished.
- End-to-End - connects the end of one task to the end of another.This means that the target task can't end before the start task is finished.
Here's how the definition of a Project with connected tasks looks:
    const project = {
                    type: 'project',
                    label: 'Project A',
                    dateStart: '2020-1-1',
                    dateEnd: '2020-12-31',
                    progress: 50,
                    connections: [
                        {
                            target: 1,
                            type: 2
                        }
                    ],
                    tasks: [
                        {
                            type: 'task',
                            label: 'Task A',
                            dateStart: '2020-1-1',
                            dateEnd: '2020-6-31',
                            connections: [
                                {
                                    target: 2,
                                    type: 0
                                }
                            ]
                        },
                        {
                            type: 'task',
                            label: 'Task B',
                            dateStart: '2020-6-1',
                            dateEnd: '2020-12-31'
                        }]
                };
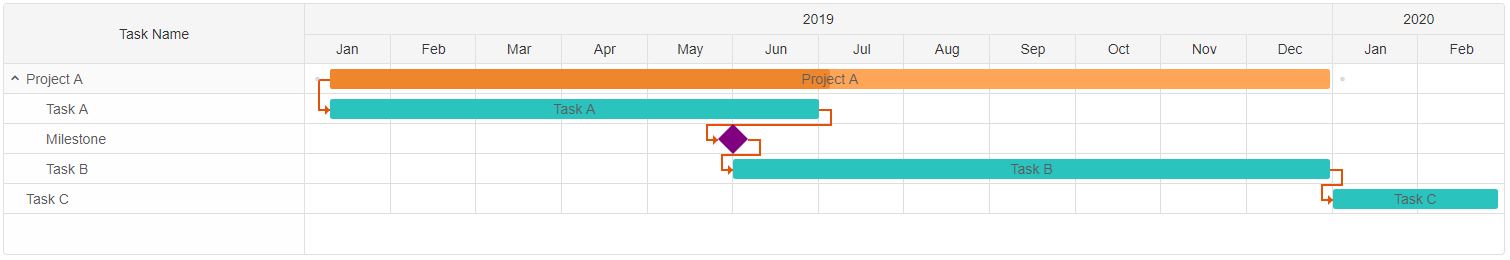
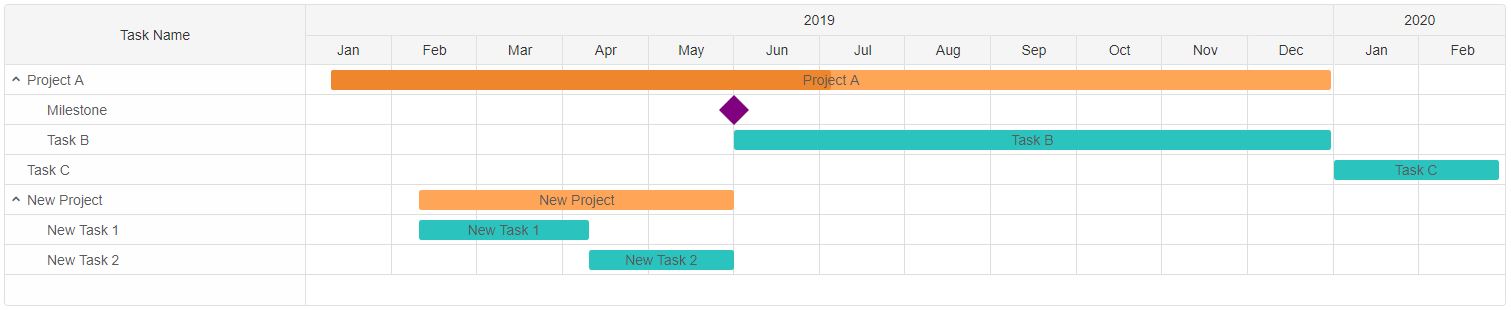
Here's how to craete a connected tasks Timeline:
[
{
	type: 'project',
	label: 'Project A',
	dateStart: '2020-1-10',
	dateEnd: '2020-12-31',
	progress: 50,
	expanded: true,
	connections: [
		{
			target: 1,
			type: 0
		}
	],
	tasks: [
		{
			type: 'task',
			label: 'Task A',
			dateStart: '2020-1-10',
			dateEnd: '2020-6-31',
			connections: [
				{
					target: 2,
					type: 1
				}
			]
		},
		 {
			type: 'milestone',
			label: 'Milestone',
			dateStart: '2020-6-1',
			connections: [
				{
					target: 3,
					type: 1
				}
			]
		},
		{
			type: 'task',
			label: 'Task B',
			dateStart: '2020-6-1',
			dateEnd: '2020-12-31',
			connections: [
				{
					target: 4,
					type: 1
				}
			 ]
		}]
},
{
	type: 'task',
	label: 'Task C',
	dateStart: '2020-1-1',
	dateEnd: '2020-02-28'
}
]
Demo
Task connections can be created/delete via the API methods as well:
- createConnection - Creates a connection between two tasks.
- removeConnection - Removes a specific connection by targetIndex, sourceIndex and type of connection.
- removeTaskConnection - Removes connections of a task or connections between the source task and the target task. Depends on the arguments. The first arguments of the method indicates the source task. If the second argument is omitted the method will delete all connections of the source task. If not the connection between the source and target task will be removed. Used to delete a connection between tasks without knowing the type of the connection.
- removeAllConnections - Removes all connections between the tasks.
//Creates three connections
ganttChart.createConnection(0, 1, 0);
ganttChart.createConnection(1, 2, 2);
ganttChart.createConnection(1, 3, 0);
ganttChart.createConnection(2, 3, 1);

//Removes a specific connection
ganttChart.removeConnection(0, 1, 0);

//Removes the connection between Task 1 and 2
ganttChart.removeTaskConnection(1, 2);

//Removes all connections of Task 1
ganttChart.removeTaskConnection(1);

//Removes all Task connections
ganttChart.removeAllConnections();
Demo
Editing
Tasks are defined via the dataSource property but can be updated via the API methods. DataSource can also be used to modify more settings and/or multiple tasks at once.
-
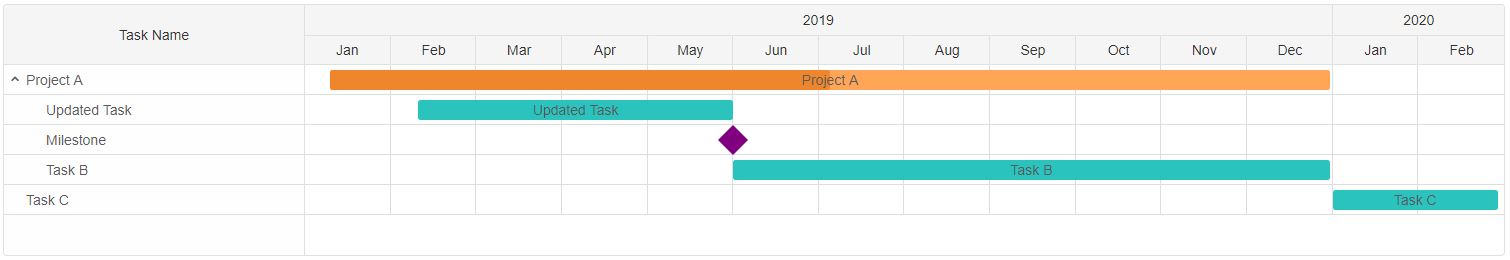
updateTask allows the user to edit the settings of a Task:
const taskSettings = {
	label: 'Updated Task',
	dateStart: '2020-02-10',
	dateEnd: '2020-06-01'
};

//Updates the settings of Task 1
ganttChart.updateTask(1, taskSettings);
Demo
Tasks can also be inserted or removed via methods:
-
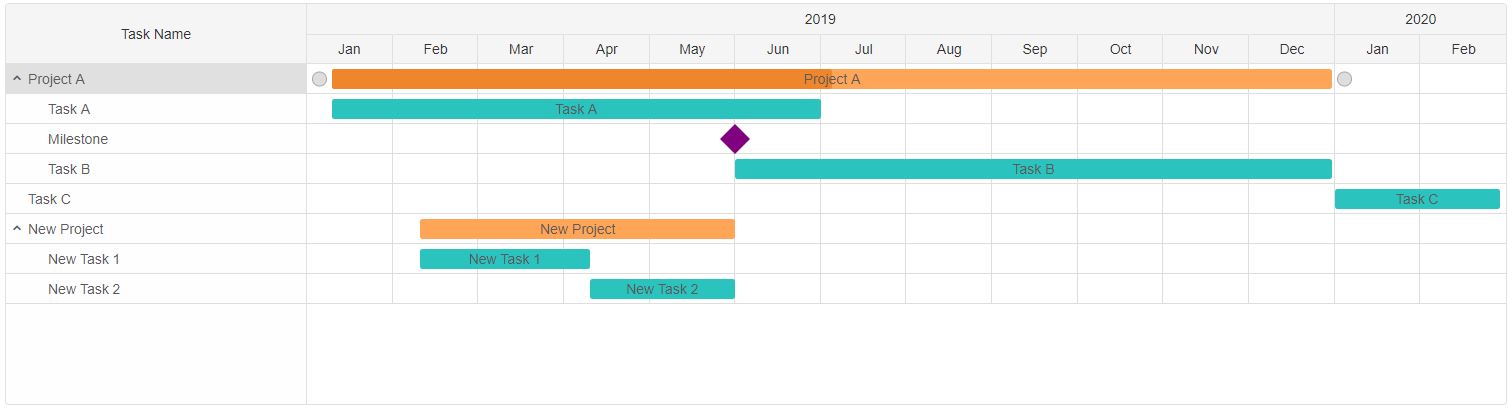
insertTask can be used to insert a new Task. Tasks can be inserted before or after another. Although the user can insert a Project Task with sub-projects( or/and tasks).
const newProjectTask = {
		type: 'project',
		label: 'New Project',
		dateStart: '2020-02-10',
		dateEnd: '2020-06-01',
		expanded: true,
		tasks: [
			{
				type: 'task',
				label: 'New Task 1',
				dateStart: '2020-02-10',
				dateEnd: '2020-04-10',
			},
			{
				type: 'task',
				label: 'New Task 2',
				dateStart: '2020-04-10',
				dateEnd: '2020-06-01',
			}
		]
	};

//Updates the settings of Task 1
ganttChart.insertTask(1, taskSettings);
Let's insert a new Project with two sub-tasks in the end of the task list:
Demo
-
removeTask deletes a Task from the list and all of it's connections. This method requires only a Task index to be passed as an argument to delete the corresponding task.
For example, let's remove 'Task A' from 'Project A':
            //Removes Task with index 1
            ganttChart.removeTask(1);
Demo
Task connections can't be edited. When creating a new task on a task that already has a connection the present is removed and the new one is created.
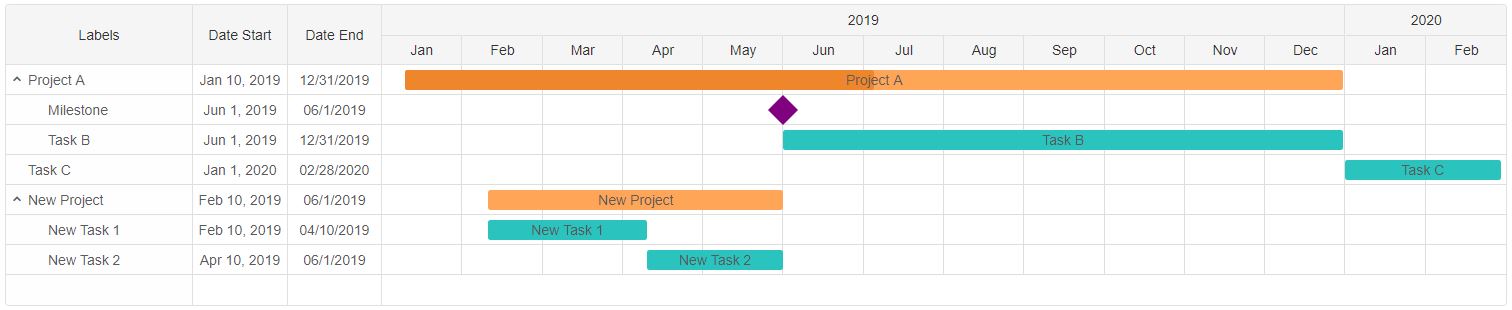
Task Tree columns can also be edited. The user can set which properties of the Tasks should be visible inside the Task Tree as separate columns.
taskColumns property determines the columns inside the Task Tree. It accepts an array of objects. Each object determines the properties for the column. Here's an example:
            //Set a new Size for the Task Tree
            ganttChart.treeSize = '25%';

            //Configure the Tree Task Columns
            ganttChart.taskColumns = [
                {
                    label: 'Labels',
                    value: 'label'
                },
                {
                    label: 'Date Start',
                    value: 'dateStart',
                    size: '25%',
                    //Custom format function
                    formatFunction: function(date) {
                        return new Date(date).toLocaleDateString(ganttChart.locale, {
                            year: 'numeric',
                            month: 'short',
                            day: 'numeric'
                        });
                    }
                },
                {
                    label: 'Date End',
                    value: 'dateEnd',
                    size: '25%'
                }
            ];
Demo
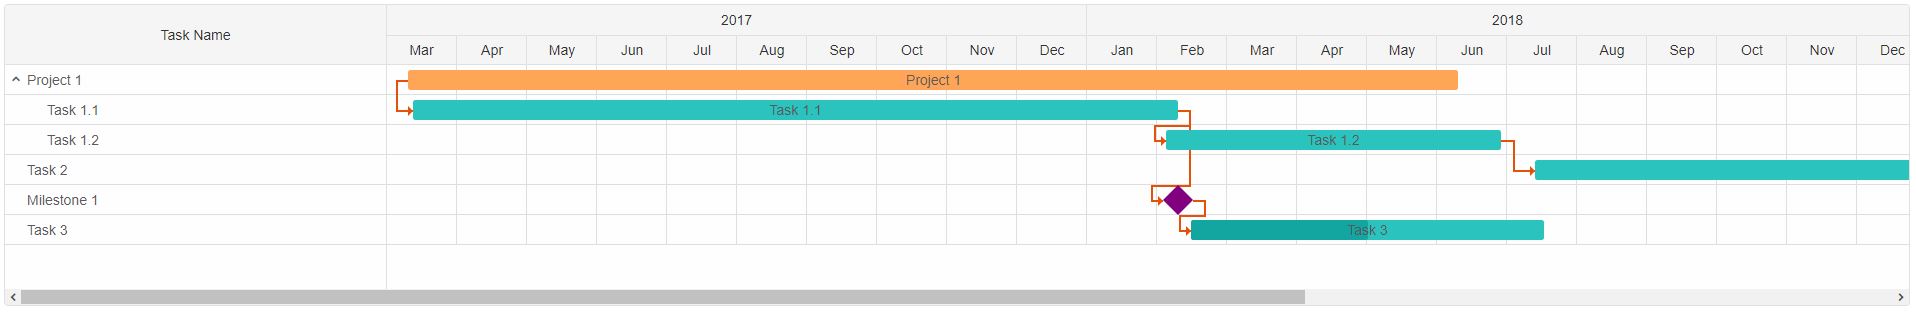
Auto Schedule
Auto schedule re-calculates the starting dates of all connected tasks and re-schedules them in order to meet the requirements defined by the connections. When autoSchedule is set scheduled tasks have date restrictions in order to assure that a task doesn't start or end on an invalid date. When changing the duration or start/end dates of a task that is connected to another, it's siblings are re-scheduled when the operation is completed.
autoScheduleStrictMode is an additional feature that locks the tasks and re-schedules them strictly to their optimal start/end dates. Once locked the tasks can't be dragged nor resized.
Connection's lag attribute is used by the Auto scheduling algorithm in order allow some slack time before or after the next task begins/ends. Lag accepts a number and is measured in miliseconds. It can be a negative ('lead') or a positive ('lag') number.
Here's an example:
          const ganttChart = new jqxGantt("#gantt", {
source: [
{
	label: 'Project 1',
	dateStart: '2017-03-10T12:30:00',
	dateEnd: '2018-06-10T3:59:00',
	type: 'project',
	expanded: true,
	connections: [
		{
			target: 1,
			type: 0,
			lag: 2 * 24 * 60 * 60 * 1000 //2 days lag
		}
	],
	tasks: [
		{
			label: 'Task 1.1',
			dateStart: '2017-02-10',
			dateEnd: '2018-01-10',
			type: 'task',
			connections: [
				{
					target: 2,
					type: 1,
					lag: -5 * 24 * 60 * 60 * 1000 // -5 days lag
				},
				{
					target: 4,
					type: 1
				}
			]
		},
		{
			label: 'Task 1.2',
			dateStart: '2017-10-10',
			dateEnd: '2018-2-31',
			type: 'task',
			connections: [
				{
					target: 3,
					type: 1,
					lag: 15 * 24 * 60 * 60 * 1000 // 15 days lag
				}
			]
		}
	]
},
{
	label: 'Task 2',
	dateStart: '2017-03-10T15:30:00',
	dateEnd: '2018-08-10',
	type: 'task'
},
{
	label: 'Milestone 1',
	dateEnd: '2018-05-24',
	type: 'milestone',
	connections: [
		{
			target: 5,
			type: 1,
			lag: 5 * 24 * 60 * 60 * 1000 //5 days lag
		}
	]
},
{
	label: 'Task 3',
	dateStart: '2018-02-05',
	dateEnd: '2018-07-08',
	progress: 50,
	type: 'task'
}
],
autoScheduleStrictMode: true
});
Demo
Save/Load State
Most GanttChart users make frequent changes to the Tasks. Some of them might not agree with the changes made by others or a restore point might be required. For that purpose saving the current state of the Timeline is crucial. Several restore points could be created so different states of the Timeline can be reloaded. The GanttChart element offers the following methods for State Maintanance:
- getState - returns the current list of Tasks and their settings. Can set directly as dataSource.
- saveState - saves the current state of the GanttChart to localStorage. Requires an ID to be set to the element.
- loadState - loads a previously saved state of the element. Accepts one argument - the state to load to. If no arguments are provided, localStorage lookup will be performed in order to find a previously saved state according to the id of the element. Requires an ID to be set to the element.
- clearState - removes any stored state of the element according to it's id. Requires an ID to be set to the element.
 let savedState = ganttChart.getState();

//Make some changes to the tasks
//...

//Reload the element with the saved tasks
 ganttChart.loadState(savedState);

//Clear the saved state
 ganttChart.clearState();