jQWidgets Forums

jQuery UI Widgets Forums Chart Saving modified Spline Chart into excel

This topic contains 2 replies, has 3 voices, and was last updated by  Peter Stoev 12 years ago.

Viewing 3 posts - 1 through 3 (of 3 total)
  • Author
  • Saving modified Spline Chart into excel #19803

    hellboy
    Member

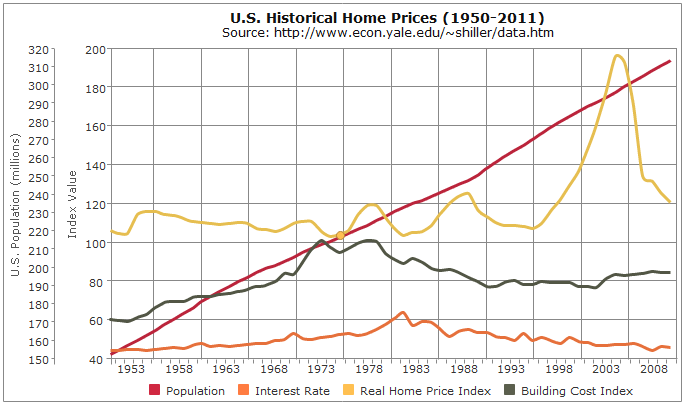
    Hi – I have a Spline Chart something like your example (http://www.jqwidgets.com/wp-content/uploads/2012/02/jquery-chart-spline.png) where lets say one of the lines is dependent on data sample of another one. e.g. in this example, lets say, Building Cost should automatically grow when Interest Rate would increase.
    What I want is –
    1. To drag Interest Rate to a higher/lower position in the chart and find out how much increment (+ or -) is happening to Building Cost. The Rate of Increment (+ or -) should be calculated from historical data based on which the chart has been rendered.
    2. I should be able to save the new data points in an excel.

    Can anyone please help me with inputs on this? Is this possible with out of the box features, otherwise how can this be achieved? An example would greatly help.
    Thanks in advance.

    Saving modified Spline Chart into excel #19804

    codefreak
    Member

    I do have a similar requirement, please let me know if this is possible. Basically I want a draggable line chart, the component should provide me the modified datapoints. Is it possible?

    Saving modified Spline Chart into excel #19807

    Peter Stoev
    Keymaster

    Hi,

    I am afraid that the requested functionality is not supported and it currently not in our development plans about jqxChart.

    Best Regards,
    Peter Stoev

    jQWidgets Team
    http://www.jqwidgets.com/

Viewing 3 posts - 1 through 3 (of 3 total)

You must be logged in to reply to this topic.